Descriptive statistics
Thijmen Jeroense
Last compiled on 22 september, 2023
Descriptive statistics
Goal of this script is to show how to recreate the different tables and graphs in our paper.
Set up
Packages
#library
library(tidyverse)
library(data.table)
library(kableExtra)
library(patchwork)
library(ggpubr)
library(lme4)
library(viridis)
library(survival)
library(broom)
library(ggthemes)
Import
#load prepared data.
load("datafiles/data-processed/disaggregated_data/2022-06-13_dyad-survival-data-imputed.rda")

MyData <- nonkin_survival_data_lead_dependent_imputed

#change scientific notation
options(scipen = 999)

#rename dropped_lead into dropped, so we can easily repreoduce this code.
MyData <- MyData %>%
  rename(dropped = dropped_lead)
#last dataprep
MyData <- MyData %>%
mutate(
educ_ego = educ_ego - 4,
age = leeftijd - 15,
age_sq = age * age,
age_alter = age_alter - 1,
educ_alter = educ_alter - 4,
length_rel_member = length_rel_member - 1,
length_rel_total = length_rel_total - 1,
size = size - 1,
ei_alter_gender_rev = (2 - (MyData$ei_alter_gender + 1)) - 1,
ei_alter_ethnicity_rev = (2 - (MyData$ei_alter_ethnicity + 1)) - 1,
origin_rec_nar = ifelse(is.na(origin_rec_nar), 3, origin_rec_nar),
origin_rec_nar_fac = factor(
origin_rec_nar,
levels = 0:3,
labels = c("None", "Non-western", "Western", "Missing")
),
origin_alter_rec = ifelse(is.na(origin_alter_rec), 3, origin_alter_rec),
origin_alter_rec_fac = factor(
origin_alter_rec,
levels = 0:3,
labels = c("None", "Non-western", "Western", "Missing")
),
length = ifelse(is.na(length), 4, length),
length_fac = factor(
length,
levels = 1:4,
labels = c("< 3 years",
"3 - 6 years",
"> 6 years",
"Length missing")
)
)
#scale variables for me models
MyData <- MyData %>%
mutate(avsim_alter_educ_cen = scale(avsim_alter_educ),
avsim_alter_age_cen = scale(avsim_alter_age),
ei_alter_gender_rev_cen = scale(ei_alter_gender_rev),
ei_alter_ethnicity_rev_cen = scale(ei_alter_ethnicity_rev),
length_rel_member_cen = scale(length_rel_member),
length_rel_total_cen = scale(length_rel_total),
size_cen = scale(size),
degree_cen = scale(degree))Descriptive statistics
Descriptive statistics table
Full descriptive statistics table of the variables in the final sample as used in the paper.
#create descriptive statistics table
desstats_table <- MyData %>%
  mutate(
    no_mig = ifelse(origin_rec_nar == 0, 1, 0),
    nonwestern_mig = ifelse(origin_rec_nar == 1, 1, 0),
    western_mig =  ifelse(origin_rec_nar == 2, 1, 0),
    no_mig_a =  ifelse(origin_alter_rec == 0, 1, 0),
    nonwestern_mig_a =  ifelse(origin_alter_rec == 1, 1, 0),
    western_mig_a =  ifelse(origin_alter_rec == 2, 1, 0),
    rel_a_b3 = ifelse(length == 1, 1, 0),
    rel_a_36 = ifelse(length == 2, 1, 0),
    rel_a_o6 = ifelse(length == 3, 1, 0),
    rel_missing = ifelse(is.na(length), 1, 0),
    partner_fam = ifelse(as.numeric(rel_alter_rec) == 1, 1, 0),
    closefam = ifelse(as.numeric(rel_alter_rec) == 2, 1, 0),
    otherfam = ifelse(as.numeric(rel_alter_rec) == 3, 1, 0),
    coll = ifelse(as.numeric(rel_alter_rec) == 4, 1, 0),
    samegroup = ifelse(as.numeric(rel_alter_rec) == 5, 1, 0),
    neighbour = ifelse(as.numeric(rel_alter_rec) == 6, 1, 0),
    friend = ifelse(as.numeric(rel_alter_rec) == 7, 1, 0),
    advisor = ifelse(as.numeric(rel_alter_rec) == 8, 1, 0),
    otherrel = ifelse(as.numeric(rel_alter_rec) == 9, 1, 0),
    not_dear = ifelse(as.numeric(dear_alter_rec) == 0, 1, 0),
    dear = ifelse(as.numeric(dear_alter_rec) == 1, 1, 0),
    not_asked = ifelse(as.numeric(dear_alter_rec) == 2, 1, 0),
    not_divorced = ifelse(as.numeric(divorced_fac) == 1, 1, 0),
    divorced = ifelse(as.numeric(divorced_fac) == 2, 1, 0),
    divorced_missing = ifelse(as.numeric(divorced_fac) == 3, 1, 0),
    no_move = ifelse(as.numeric(moving_fac) == 1, 1, 0),
    new_res = ifelse(as.numeric(moving_fac) == 2, 1, 0),
    new_mun = ifelse(as.numeric(moving_fac) == 3, 1, 0),
    move_mis = ifelse(as.numeric(moving_fac) == 4, 1, 0),
    female = ifelse(as.numeric(gender_fac) == 2, 1, 0),
    first_child_rec = ifelse(first_child == 1, 1, 0),
    first_child_missing = ifelse(first_child == 2, 1, 0),
    female_alter = ifelse(gender_alter_fac == "Female", 1, 0),
    male_alter = ifelse(gender_alter_fac == "Male", 1, 0),
    missing_gender_alter = ifelse(gender_alter_fac == "Missing", 1, 0)
  ) %>%
  select(
    dropped,
    dyad_educ_sim_cen,
    dyad_gender_sim_cen,
    dyad_age_sim_cen,
    dyad_ethnicity_sim_cen,
    avsim_alter_educ_cen,
    avsim_alter_age_cen,
    ei_alter_gender_rev_cen,
    ei_alter_ethnicity_rev_cen,
    not_dear,
    dear,
    not_asked,
    degree_cen,
    educ_ego_cen,
    age_cen,
    female,
    no_mig,
    nonwestern_mig,
    western_mig,
    divorced,
    new_res,
    new_mun,
    first_child_rec,
    educ_alter_cen,
    age_alter_cen,
    female_alter,
    no_mig_a,
    nonwestern_mig_a,
    western_mig_a,
    coll,
    samegroup,
    neighbour,
    friend,
    advisor,
    otherrel,
    times_dropped_earlier_cen,
    rel_a_b3,
    rel_a_36,
    rel_a_o6,
    net_density_cen,
    size_cen,
    censor
  ) %>%
  psych::describe() %>%
  mutate(
    name = c(
      "Dropped",
      "Dyadic similarity: education",
      "Dyadic similarity: gender",
      "Dyadic similarity: age",
      "Dyadic similarity: ethnicity",
      "Confidant uniqueness education",
      "Confidant uniquenessy age",
      "Confidant uniqueness gender",
      "Confidant uniqueness ethnicity",
      "Confidant is not dear",
      "Confidant is dear",
      "Closeness not asked",
      "Embeddedness",
      "Education ego",
      "Age",
      "Female",
      "No migration background",
      "Non-western migration background",
      "Western migration background",
      "Divorced (ref. not)",
      "New residence (ref. no move)",
      "New municipality",
      "First child born",
      "Education alter",
      "Age alter",
      "Alter is female",
      "No migration background confidant ",
      "Non-western migration background confidant",
      "Western migration background confidant",
      "Colleague",
      "Same group or club",
      "Neighbour",
      "Friend",
      "Advisor",
      "Other relation",
      "Times dropped earlier",
      "Knows confidant for < 3 years",
      "Knows confidant for 3-6 years",
      "Knows confidant  > 6 years",
      "Net density",
      "Net size",
      "Censored"
    )
  ) %>%
  select(name, n, mean, sd, median, min, max)

desstats_table %>%
  kbl(caption = "Table 1. Descriptive statistics of discrete time hazard models 1-6",
      digits = 3,
      row.names = F) %>%
  kable_classic(
    full_width = F,
    bootstrap_options = c("hover", "condensed"),
    fixed_thead = T
)| name | n | mean | sd | median | min | max |
|---|---|---|---|---|---|---|
| Dropped | 49449 | 0.643 | 0.479 | 1.000 | 0.000 | 1.000 |
| Dyadic similarity: education | 49449 | 0.000 | 1.000 | 0.364 | -4.982 | 0.850 |
| Dyadic similarity: gender | 49449 | 0.000 | 1.000 | 0.459 | -2.184 | 0.459 |
| Dyadic similarity: age | 49449 | 0.000 | 1.000 | -0.008 | -8.310 | 0.747 |
| Dyadic similarity: ethnicity | 49449 | 0.000 | 1.000 | 0.420 | -2.542 | 0.420 |
| Confidant uniqueness education | 49449 | 0.000 | 1.000 | 0.000 | -6.311 | 1.271 |
| Confidant uniquenessy age | 49449 | 0.000 | 1.000 | 0.097 | -7.208 | 1.344 |
| Confidant uniqueness gender | 49449 | 0.000 | 1.000 | 0.144 | -2.084 | 1.258 |
| Confidant uniqueness ethnicity | 49449 | 0.000 | 1.000 | 0.398 | -3.840 | 0.398 |
| Confidant is not dear | 49449 | 0.249 | 0.432 | 0.000 | 0.000 | 1.000 |
| Confidant is dear | 49449 | 0.106 | 0.308 | 0.000 | 0.000 | 1.000 |
| Closeness not asked | 49449 | 0.645 | 0.479 | 1.000 | 0.000 | 1.000 |
| Embeddedness | 49449 | 0.000 | 1.000 | -0.229 | -1.791 | 1.332 |
| Education ego | 49449 | 0.000 | 1.000 | -0.202 | -2.782 | 1.346 |
| Age | 49449 | 0.000 | 1.000 | 0.042 | -1.722 | 3.115 |
| Female | 49449 | 0.567 | 0.496 | 1.000 | 0.000 | 1.000 |
| No migration background | 49449 | 0.817 | 0.387 | 1.000 | 0.000 | 1.000 |
| Non-western migration background | 49449 | 0.045 | 0.208 | 0.000 | 0.000 | 1.000 |
| Western migration background | 49449 | 0.080 | 0.272 | 0.000 | 0.000 | 1.000 |
| Divorced (ref. not) | 49449 | 0.023 | 0.149 | 0.000 | 0.000 | 1.000 |
| New residence (ref. no move) | 49449 | 0.019 | 0.135 | 0.000 | 0.000 | 1.000 |
| New municipality | 49449 | 0.009 | 0.096 | 0.000 | 0.000 | 1.000 |
| First child born | 49449 | 0.003 | 0.055 | 0.000 | 0.000 | 1.000 |
| Education alter | 49449 | 0.000 | 1.000 | -0.287 | -3.081 | 1.389 |
| Age alter | 49449 | 0.000 | 1.000 | -0.072 | -1.889 | 1.744 |
| Alter is female | 49449 | 0.590 | 0.492 | 1.000 | 0.000 | 1.000 |
| No migration background confidant | 49449 | 0.918 | 0.274 | 1.000 | 0.000 | 1.000 |
| Non-western migration background confidant | 49449 | 0.047 | 0.212 | 0.000 | 0.000 | 1.000 |
| Western migration background confidant | 49449 | 0.029 | 0.167 | 0.000 | 0.000 | 1.000 |
| Colleague | 49449 | 0.094 | 0.291 | 0.000 | 0.000 | 1.000 |
| Same group or club | 49449 | 0.045 | 0.206 | 0.000 | 0.000 | 1.000 |
| Neighbour | 49449 | 0.059 | 0.235 | 0.000 | 0.000 | 1.000 |
| Friend | 49449 | 0.753 | 0.431 | 1.000 | 0.000 | 1.000 |
| Advisor | 49449 | 0.010 | 0.101 | 0.000 | 0.000 | 1.000 |
| Other relation | 49449 | 0.037 | 0.190 | 0.000 | 0.000 | 1.000 |
| Times dropped earlier | 49449 | 0.000 | 1.000 | -0.384 | -0.384 | 8.772 |
| Knows confidant for < 3 years | 49449 | 0.116 | 0.320 | 0.000 | 0.000 | 1.000 |
| Knows confidant for 3-6 years | 49449 | 0.175 | 0.380 | 0.000 | 0.000 | 1.000 |
| Knows confidant > 6 years | 49449 | 0.701 | 0.458 | 1.000 | 0.000 | 1.000 |
| Net density | 49449 | 0.000 | 1.000 | 0.275 | -2.714 | 0.873 |
| Net size | 49449 | 0.000 | 1.000 | 0.762 | -2.824 | 0.762 |
| Censored | 49449 | 0.158 | 0.365 | 0.000 | 0.000 | 1.000 |
Describing confidant loss
Life table
Recreate a life-table with the survival package. This is a KM fit, from which we can create a graphical representation of the survival and hazard function.
#extract number of dyads, ego, and dyad spells
dyad_ids <- unique(MyData$dyad_id)
ego_ids <- unique(MyData$nomem_encr)
process_ids <- unique(MyData$process_id)

#create survival data to use with surcfit.
survival_data <- MyData %>%
  group_by(process_id) %>%
  filter(time == max(time)) %>%
  ungroup()

#estimate KM
km_fit <- survfit(Surv(time, 1-censor) ~ 1, data=survival_data, se.fit = T)

#life table
km_fit %>%
  tidy() %>%
  select(1:5) %>%
  mutate(hazard = n.event / n.risk,
         time = time) %>%
  rename(period = time,
         survival = estimate) %>%
  kbl(caption = "Table 1. Life table",
      digits = 3,
      row.names = F) %>%
  kable_classic(
    full_width = F,
    bootstrap_options = c("hover", "condensed"),
    fixed_thead = T
)| period | n.risk | n.event | n.censor | survival | hazard |
|---|---|---|---|---|---|
| 1 | 35526 | 26170 | 2105 | 0.263 | 0.737 |
| 2 | 7251 | 3489 | 696 | 0.137 | 0.481 |
| 3 | 3066 | 1156 | 363 | 0.085 | 0.377 |
| 4 | 1547 | 484 | 197 | 0.058 | 0.313 |
| 5 | 866 | 235 | 107 | 0.043 | 0.271 |
| 6 | 524 | 121 | 89 | 0.033 | 0.231 |
| 7 | 314 | 73 | 44 | 0.025 | 0.232 |
| 8 | 197 | 49 | 47 | 0.019 | 0.249 |
| 9 | 101 | 20 | 24 | 0.015 | 0.198 |
| 10 | 57 | 10 | 47 | 0.012 | 0.175 |
#export life table for office
life_table <- km_fit %>%
  tidy() %>%
  select(1:5) %>%
  mutate(hazard = n.event / n.risk,
         time = time) %>%
  rename(period = time,
         survival = estimate)
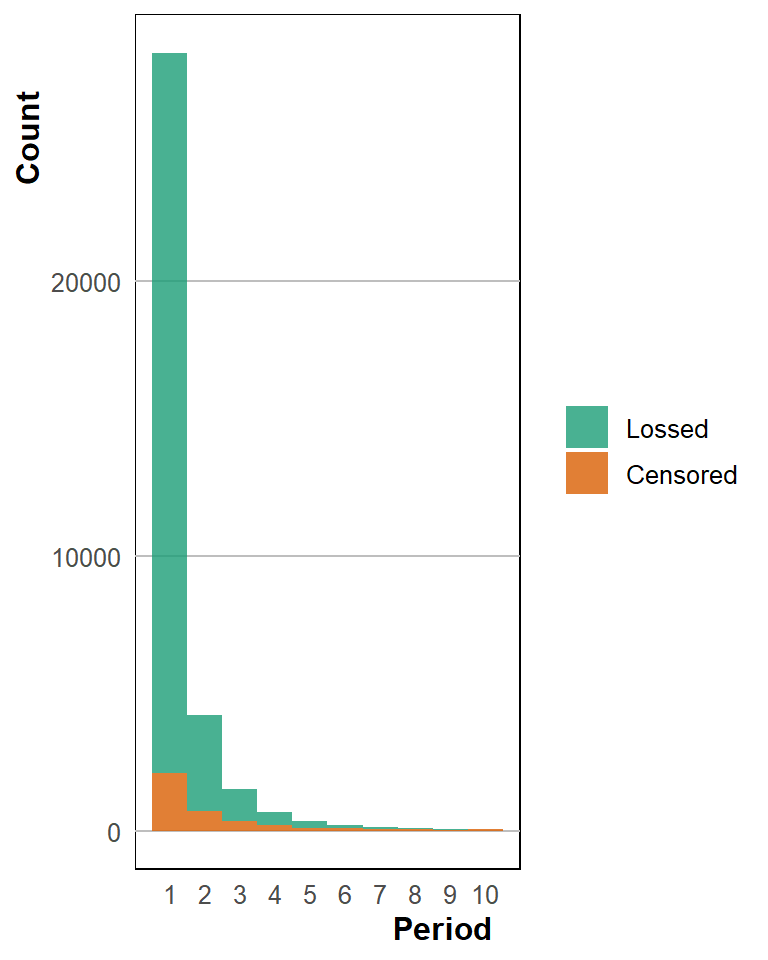
Histogram of confidant loss
Recreate the histogram of confidant loss. These show the number of observations per wave and also a presentation of a random set of dyad spells.
survival_hist <- survival_data %>%
  mutate(censor  = factor(
    censor,
    levels = 0:1,
    labels = c("Lossed", "Censored")
  )) %>%
  ggplot(aes(x = time, fill = as.factor(censor))) +
  geom_histogram(binwidth = 1,
                     alpha = 0.8) +
  scale_x_continuous(breaks = 1:10) +
  scale_fill_manual(values = c("#1b9e77",
                               "#d95f02")) +
  theme(
    panel.background = element_rect(fill = "#FFFFFF",
                                        colour = "black"),
    plot.background = element_rect(fill = "#FFFFFF"),
    panel.grid = element_line(colour = "grey"),
    panel.grid.major.x = element_blank(),
    text = element_text(family = "sans", size = 12),
    axis.title.x = element_text(hjust = 0.9, face = "bold"),
    axis.text.x = element_text(),
    axis.line = element_blank(),
    axis.title.y = element_text(hjust = 0.9, face = "bold"),
    axis.ticks = element_blank(),
    strip.background = element_rect(fill = "#A9A9A9"),
    panel.grid.minor = element_blank(),
    legend.position = "right",
    legend.title = element_blank(),
    legend.background = element_rect(fill = "#FFFFFF"),
    legend.key = element_rect(fill = "#FFFFFF")
  ) +
  labs(x = "Period", y = "Count")

#
set.seed(2023)

#Did not include this figure in the text
survival_censor_bar <- survival_data %>%
  sample_n(25) %>%
  mutate(censor  = factor(
    censor,
    levels = 0:1,
    labels = c("dissolved", "censored")
  )) %>%
  ggplot(aes(process_id, time)) +
  geom_bar(stat = "identity", width = 0.5) +
  geom_point(aes(
    process_id,
    time,
    color = as.factor(censor),
    shape = as.factor(censor)
  ),
  size = 4) +
  coord_flip() +
  scale_y_continuous(limit = c(0, 10), breaks = 1:10) +
  scale_color_viridis(discrete = T,
                      alpha = 0.9,
                      option = "D") +
  theme(
    panel.background = element_rect(fill = "#FFFFFF"),
    plot.background = element_rect(fill = "#FFFFFF"),
    panel.grid = element_line(colour = "grey"),
    panel.grid.major.y = element_blank(),
    panel.grid.minor.y = element_blank(),
    panel.grid.major.x = element_blank(),
    text = element_text(family = "sans", size = 12),
    axis.title.x = element_text(hjust = 0.9, face = "bold"),
    axis.text.x = element_text(),
    axis.line = element_blank(),
    axis.title.y = element_text(hjust = 0.9, face = "bold"),
    axis.ticks = element_blank(),
    strip.background = element_rect(fill = "#A9A9A9"),
    panel.grid.minor = element_blank(),
    legend.position = "top",
    legend.title = element_blank(),
    legend.background = element_rect(fill = "#FFFFFF"),
    legend.key = element_rect(fill = "#FFFFFF")
  ) +
  labs(y = "Period", x = "Dyad Spell ID")

# save in object
surv_desstats_1 <- survival_hist

ggsave(surv_desstats_1,
       file = "plots/results/survival/surv_desstats_1.jpg",
       width = 4,
       height = 3,
       dpi = 320)

# show graph
surv_desstats_1
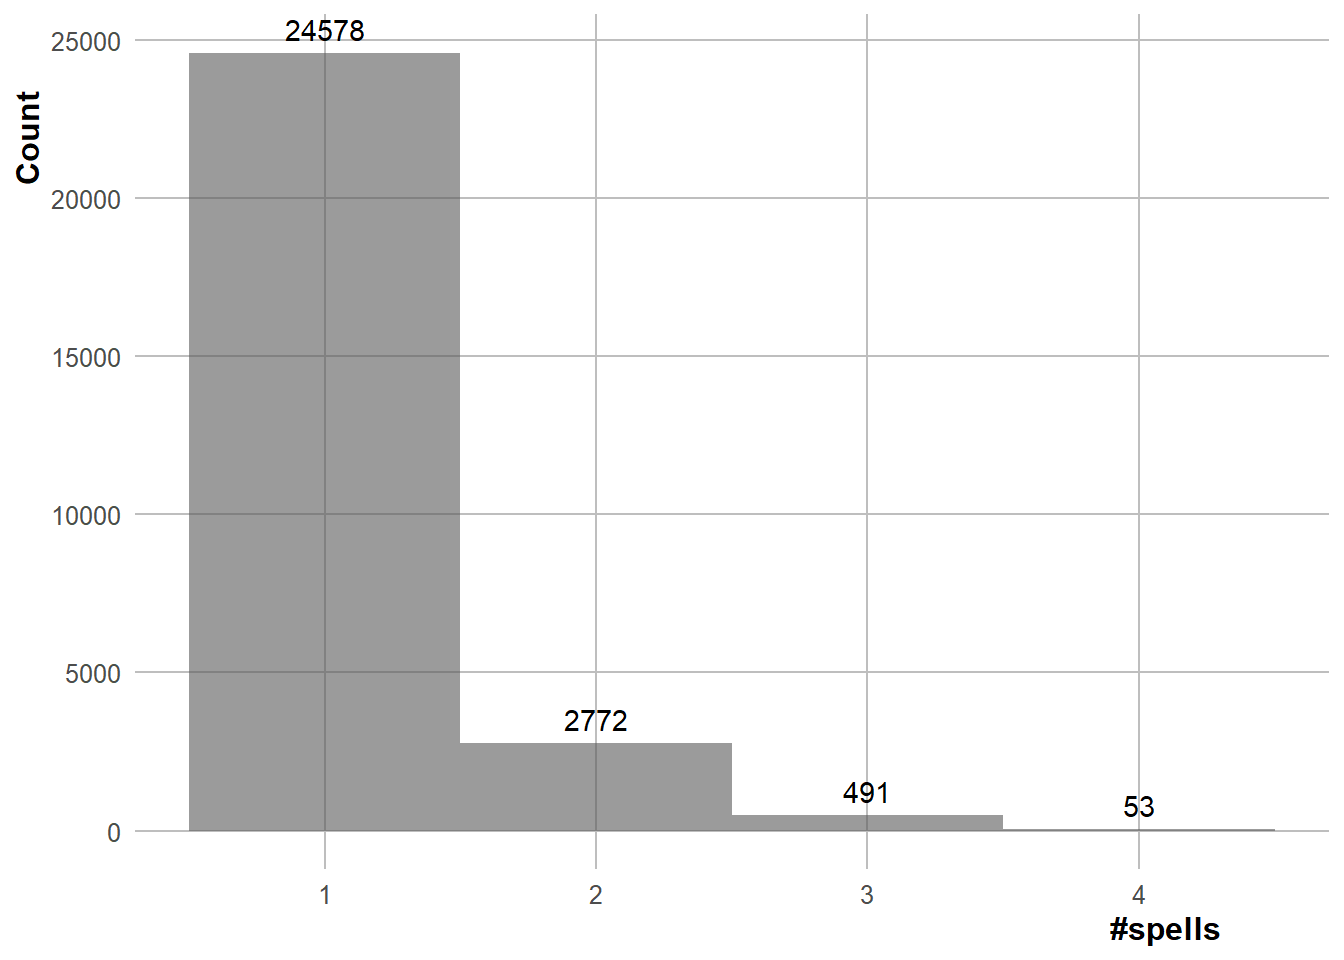
Count repeating dyads
Number of repeating dyads. First bit of code is used to calculate the % of dyads that only last for one spell (of one period). Second bit of code creates a bar chart with the number of dyads that have X dyad spells, which shows that the maximum number of dyad spells that a dyad can have is four.
MyData %>%
  select(dyad_id,
         nomem_encr,
         process_id,
         time,
         times_dropped_earlier,
         censor,
         dropped) %>%
  filter(censor == 0) %>%
  group_by(dyad_id, process_id) %>%
  summarise(n_process_id = n()) %>%
  ungroup() %>%
  group_by(dyad_id) %>%
  mutate(n_dyad_id = n()) %>%
  ungroup() %>%
  mutate(lost_period1 = n_process_id == n_dyad_id) %>%
  group_by(lost_period1) %>%
  summarise(n()) %>%
  transpose() %>%
  filter(row_number() == 2) %>%
  mutate(prop_dropped_period1 = (V2 / (V2 + V1)) * 100) %>%
  pull(prop_dropped_period1)
[1] 68.96281
spells_plot <- MyData %>%
  select(dyad_id,
         nomem_encr,
         process_id,
         time,
         times_dropped_earlier,
         censor,
         dropped) %>%
  filter(censor == 0) %>%
  group_by(dyad_id) %>%
  summarise(max_time_dropped = max(times_dropped_earlier) + 1) %>%
  ungroup() %>%
  group_by(max_time_dropped) %>%
  ggplot(aes(x = max_time_dropped, fill = max_time_dropped)) +
  geom_histogram(binwidth = 1,
                 alpha = 0.6) +
  stat_bin(binwidth = 1,
           geom = "text",
           aes(label = ..count..),
           vjust = -0.6) +
  scale_x_continuous(breaks = 1:4) +
  scale_fill_viridis(discrete = T,
                     alpha = 0.8,
                     option = "E") +
  theme(
    panel.background = element_rect(fill = "#FFFFFF"),
    plot.background = element_rect(fill = "#FFFFFF"),
    panel.grid = element_line(colour = "grey"),
    text = element_text(family = "sans", size = 12),
    axis.title.x = element_text(hjust = 0.9, face = "bold"),
    axis.text.x = element_text(),
    axis.line = element_blank(),
    axis.title.y = element_text(hjust = 0.9, face = "bold"),
    axis.ticks = element_blank(),
    strip.background = element_rect(fill = "#A9A9A9"),
    panel.grid.minor = element_blank(),
    legend.position = "none",
    legend.title = element_blank(),
    legend.background = element_rect(fill = "#FFFFFF"),
    legend.key = element_rect(fill = "#FFFFFF")
  ) +
  labs(x = "#spells", y = "Count")

spells_plot
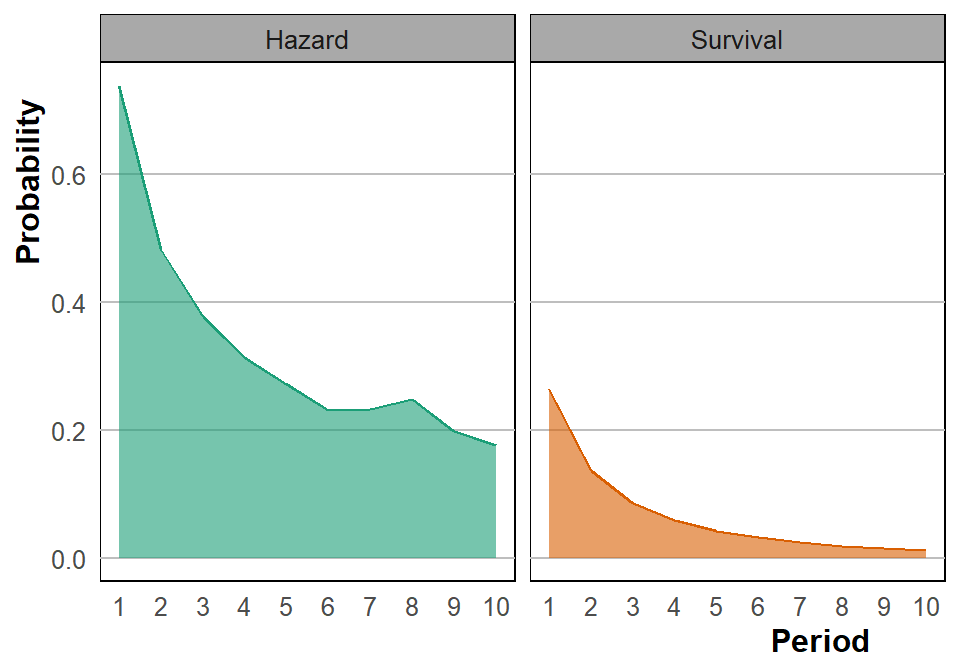
Survival and hazard graph
Recreate the survival and hazard graph.
surv_fig <- km_fit %>%
  tidy() %>%
  mutate(Hazard = n.event / n.risk,
         Survival = estimate,
         time = time) %>%
  pivot_longer(c(Survival, Hazard),
               values_to = "value",
               names_to = "surv_function") %>%
  ggplot(
    aes(
      x = time,
      y = value,
      colour = surv_function,
      shape = surv_function,
      fill = surv_function
    )
  ) +
  #geom_point(size = 2.5) +
  geom_line() +
  geom_area(alpha = 0.6) +
  facet_wrap(vars(surv_function)) +
  labs(x = "Period", y = "Probability") +
  scale_x_continuous(breaks = 1:10) +
  scale_fill_manual(values = c("#1b9e77",
                               "#d95f02")) +
  scale_colour_manual(values = c("#1b9e77",
                                 "#d95f02")) +
  theme(
    panel.background = element_rect(fill = "#FFFFFF",
                                        colour = "black"),
    plot.background = element_rect(fill = "#FFFFFF"),
    panel.grid = element_line(colour = "grey"),
    panel.grid.major.x = element_blank(),
    text = element_text(family = "sans", size = 12),
    axis.title.x = element_text(hjust = 0.9, face = "bold"),
    axis.text.x = element_text(),
    axis.line = element_blank(),
    axis.title.y = element_text(hjust = 0.9, face = "bold"),
    axis.ticks = element_blank(),
        strip.background = element_rect(fill = "#A9A9A9",
                                        colour = "black"),
    panel.grid.minor = element_blank(),
    legend.position = "none",
    legend.title = element_blank(),
    legend.background = element_rect(fill = "#FFFFFF"),
    legend.key = element_rect(fill = "#FFFFFF")
  )

#save results
ggsave(surv_fig,
       file = "plots/results/survival/surv_fig.jpg",
       dpi = 320,
       width = 5,
       height = 3.5)

#show plot
surv_fig
Dyadic similarity and confidant heterogeneity plots
Dyadic similarity plots
For similar and dissimilar dyads we estimate the survival function Subsequently we plot these in a figure.
Data preperation
Create a plot datafile.
#educ
km_fit_educ_sim_high <- survfit(Surv(time, 1-censor) ~ 1, subset = (dyad_educ_sim == 1), data=survival_data, se.fit = T)
km_fit_educ_sim_low <- survfit(Surv(time, 1-censor) ~ 1, subset = (dyad_educ_sim < 1), data=survival_data, se.fit = T)

educ_low <- km_fit_educ_sim_low %>%
  tidy() %>%
  select(1:5,7,8)  %>%
  mutate(hazard = n.event / n.risk,
         sim = "Dissimilar") %>%
  rename(period = time,
         survival = estimate)

educ_high <- km_fit_educ_sim_high %>%
  tidy() %>%
  select(1:5,7,8)  %>%
  mutate(hazard = n.event / n.risk,
         sim = "Similar") %>%
  rename(period = time,
         survival = estimate)

educ_df <- rbind(educ_high, educ_low) %>%
  mutate(var = "Education")

#gender
km_fit_gender_sim_high <- survfit(Surv(time, 1-censor) ~ 1, subset = (dyad_gender_sim == 1), data=survival_data, se.fit = T)
km_fit_gender_sim_low <- survfit(Surv(time, 1-censor) ~ 1, subset = (dyad_gender_sim == 0), data=survival_data, se.fit = T)


gender_low <- km_fit_gender_sim_low %>%
  tidy() %>%
  select(1:5,7,8)  %>%
  mutate(hazard = n.event / n.risk,
         sim = "Dissimilar") %>%
  rename(period = time,
         survival = estimate)

gender_high <- km_fit_gender_sim_high %>%
  tidy() %>%
  select(1:5,7,8) %>%
  mutate(hazard = n.event / n.risk,
         sim = "Similar") %>%
  rename(period = time,
         survival = estimate)

gender_df <- rbind(gender_low, gender_high) %>%
  mutate(var = "Gender")

#ethncity
km_fit_ethncity_sim_high <- survfit(Surv(time, 1-censor) ~ 1, subset = (dyad_ethnicity_sim == 1), data=survival_data, se.fit = T)
km_fit_ethncity_sim_low <- survfit(Surv(time, 1-censor) ~ 1, subset = (dyad_ethnicity_sim == 0), data=survival_data, se.fit = T)


ethnicity_low <- km_fit_ethncity_sim_low %>%
  tidy() %>%
  select(1:5,7,8) %>%
  mutate(hazard = n.event / n.risk,
         sim = "Dissimilar") %>%
  rename(period = time,
         survival = estimate)

ethnicity_high <- km_fit_ethncity_sim_high %>%
  tidy() %>%
  select(1:5,7,8) %>%
  mutate(hazard = n.event / n.risk,
         sim = "Similar") %>%
  rename(period = time,
         survival = estimate)

ethnicity_df <- rbind(ethnicity_low, ethnicity_high) %>%
  mutate(var = "Migration background")

#age
km_fit_age_sim_high <- survfit(Surv(time, 1-censor) ~ 1, subset = (dyad_age_sim == 1), data=survival_data, se.fit = T)
km_fit_age_sim_low <- survfit(Surv(time, 1-censor) ~ 1, subset = (dyad_age_sim < 1), data=survival_data, se.fit = T)

age_low <- km_fit_age_sim_low %>%
  tidy() %>%
  select(1:5,7,8) %>%
  mutate(hazard = n.event / n.risk,
         sim = "Dissimilar") %>%
  rename(period = time,
         survival = estimate)

age_high <- km_fit_age_sim_high %>%
  tidy() %>%
  select(1:5,7,8) %>%
  mutate(hazard = n.event / n.risk,
         sim = "Similar") %>%
  rename(period = time,
         survival = estimate)

age_df <- rbind(age_low, age_high) %>%
  mutate(var = "Age")

#plot
plot_df <- rbind(gender_df, age_df, educ_df, ethnicity_df)
Plot
Create a multipanel plot.
dyadic_sim <- plot_df %>%
  ggplot(aes(
    x = period,
    y = survival,
    colour = sim,
    fill = sim
  )) +
  geom_ribbon(aes(ymin = conf.low, ymax = conf.high),
              alpha = 0.4,
              linetype = "blank") +
  geom_line() +
  facet_wrap(vars(var)) +
  labs(x = "Period", y = "Survival function") +
  scale_x_continuous(breaks = 1:10) +
  scale_y_continuous(limits = c(0, 0.35),
                     breaks = c(0, 0.10, 0.20, 0.30)) +
  scale_fill_manual(values = c("#1b9e77",
                               "#d95f02")) +
  scale_colour_manual(values = c("#1b9e77",
                                 "#d95f02")) +
  theme(
    panel.background = element_rect(fill = "#FFFFFF",
                                    colour = "black"),
    plot.background = element_rect(fill = "#FFFFFF"),
    panel.grid = element_line(colour = "grey"),
    panel.grid.major.x = element_blank(),
    text = element_text(family = "sans", size = 12),
    axis.title.x = element_text(hjust = 0.9, face = "bold"),
    axis.text.x = element_text(),
    axis.line = element_blank(),
    axis.title.y = element_text(hjust = 0.9, face = "bold"),
    axis.ticks = element_blank(),
    strip.background = element_rect(fill = "#A9A9A9",
                                    colour = "black"),
    panel.grid.minor = element_blank(),
    legend.position = "bottom",
    legend.title = element_blank(),
    legend.background = element_rect(fill = "#FFFFFF"),
    legend.key = element_rect(fill = "#FFFFFF")
  )

# save dyadic sim plot
ggsave(dyadic_sim, file = "plots/results/survival/dyad_sim_surv.jpg",
       dpi = 320,
       width = 6,
       height = 6)

#show plot
dyadic_sim
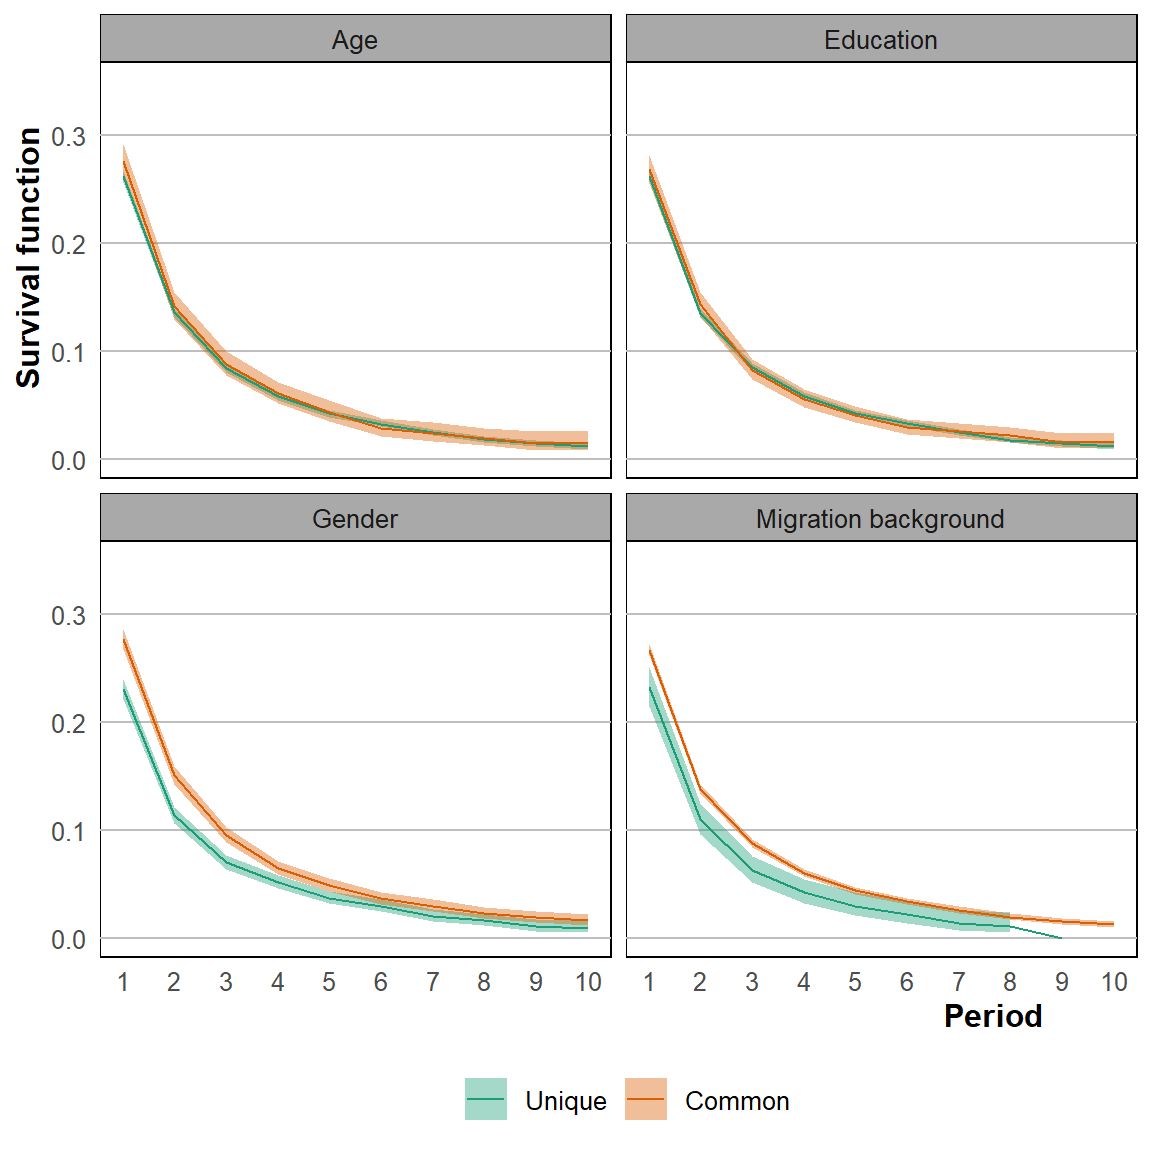
Confidant heterogeneity plots
For homogeneous and heterogeneous dyads we estimate the hazard function. Subsequently we plot these different graphs.
Data preperation
Create a plot datafile.
#educ
km_fit_educ_conf_sim_high <- survfit(Surv(time, 1-censor) ~ 1, subset = (avsim_alter_educ == 1), data=survival_data, se.fit = T)
km_fit_educ_conf_sim_low <- survfit(Surv(time, 1-censor) ~ 1, subset = (avsim_alter_educ < 1), data=survival_data, se.fit = T)

educ_low <- km_fit_educ_conf_sim_low %>%
  tidy() %>%
  select(1:5,7,8) %>%
  mutate(hazard = n.event / n.risk,
         sim = "Unique") %>%
  rename(period = time,
         survival = estimate)

educ_high <- km_fit_educ_conf_sim_high %>%
  tidy() %>%
  select(1:5,7,8) %>%
  mutate(hazard = n.event / n.risk,
         sim = "Common") %>%
  rename(period = time,
         survival = estimate)

educ_conf_df <- rbind(educ_high, educ_low) %>%
  mutate(var = "Education")

#gender
km_fit_gender_conf_sim_high <- survfit(Surv(time, 1-censor) ~ 1, subset = (ei_alter_gender_rev == 1), data=survival_data, se.fit = T)
km_fit_gender_conf_sim_low <- survfit(Surv(time, 1-censor) ~ 1, subset = (ei_alter_gender_rev < 0), data=survival_data, se.fit = T)


gender_low <- km_fit_gender_conf_sim_low %>%
  tidy() %>%
  select(1:5,7,8) %>%
  mutate(hazard = n.event / n.risk,
         sim = "Unique") %>%
  rename(period = time,
         survival = estimate)

gender_high <- km_fit_gender_conf_sim_high %>%
  tidy() %>%
  select(1:5,7,8) %>%
  mutate(hazard = n.event / n.risk,
         sim = "Common") %>%
  rename(period = time,
         survival = estimate)

gender_conf_df <- rbind(gender_low, gender_high) %>%
  mutate(var = "Gender")

#ethnicity
km_fit_ethnicity_conf_sim_high <- survfit(Surv(time, 1-censor) ~ 1, subset = (ei_alter_ethnicity_rev == 1), data=survival_data, se.fit = T)
km_fit_ethnicity_conf_sim_low <- survfit(Surv(time, 1-censor) ~ 1, subset = (ei_alter_ethnicity_rev  < 0), data=survival_data, se.fit = T)


ethnicity_low <- km_fit_ethnicity_conf_sim_low %>%
  tidy() %>%
  select(1:5,7,8) %>%
  mutate(hazard = n.event / n.risk,
         sim = "Unique") %>%
  rename(period = time,
         survival = estimate)

ethnicity_high <- km_fit_ethnicity_conf_sim_high %>%
  tidy() %>%
  select(1:5,7,8) %>%
  mutate(hazard = n.event / n.risk,
         sim = "Common") %>%
  rename(period = time,
         survival = estimate)

ethnicity_conf_df <- rbind(ethnicity_low, ethnicity_high) %>%
  mutate(var = "Migration background")

#age
km_fit_age_conf_sim_high <- survfit(Surv(time, 1-censor) ~ 1, subset = (avsim_alter_age == 1), data=survival_data, se.fit = T)
km_fit_age_conf_sim_low <- survfit(Surv(time, 1-censor) ~ 1, subset = (avsim_alter_age < 1), data=survival_data, se.fit = T)

age_low <- km_fit_age_conf_sim_low %>%
  tidy() %>%
  select(1:5,7,8) %>%
  mutate(hazard = n.event / n.risk,
         sim = "Unique") %>%
  rename(period = time,
         survival = estimate)

age_high <- km_fit_age_conf_sim_high %>%
  tidy() %>%
  select(1:5,7,8) %>%
  mutate(hazard = n.event / n.risk,
         sim = "Common") %>%
  rename(period = time,
         survival = estimate)

age_conf_df <- rbind(age_high, age_low) %>%
  mutate(var = "Age")

#plot
plot_conf_df <- rbind(gender_conf_df, age_conf_df, educ_conf_df, ethnicity_conf_df)
Plot
Create a multipanel plot.
conf_sim <- plot_conf_df %>%
   ggplot(aes(
    x = period,
    y = survival,
    colour = fct_rev(as.factor(sim)),
    fill = fct_rev(as.factor(sim))
  )) +
  geom_ribbon(aes(ymin = conf.low, ymax = conf.high),
                alpha = 0.4,
                color = "black",
              linetype = "blank") +
  geom_line() +
  facet_wrap(vars(var)) +
  labs(x = "Period", y = "Survival function") +
  scale_x_continuous(breaks = 1:10) +
  scale_y_continuous(limits = c(0, 0.35),
                     breaks = c(0,0.10,0.20,0.30)) +
  scale_fill_manual(values = c("#1b9e77",
                               "#d95f02")) +
  scale_colour_manual(values = c("#1b9e77",
                               "#d95f02")) +
  theme(
    panel.background = element_rect(fill = "#FFFFFF",
                                        colour = "black"),
    plot.background = element_rect(fill = "#FFFFFF"),
    panel.grid = element_line(colour = "grey"),
    panel.grid.major.x = element_blank(),
    text = element_text(family = "sans", size = 12),
    axis.title.x = element_text(hjust = 0.9, face = "bold"),
    axis.text.x = element_text(),
    axis.line = element_blank(),
    axis.title.y = element_text(hjust = 0.9, face = "bold"),
    axis.ticks = element_blank(),
            strip.background = element_rect(fill = "#A9A9A9",
                                        colour = "black"),
    panel.grid.minor = element_blank(),
    legend.position = "bottom",
    legend.title = element_blank(),
    legend.background = element_rect(fill = "#FFFFFF"),
    legend.key = element_rect(fill = "#FFFFFF")
  )

#save plot
ggsave(conf_sim,
       file = "plots/results/survival/conf_sim_surv.jpg",
       dpi = 320,
       width = 6,
       height = 6)

#show plot
conf_sim
Copyright © 2023 Jeroense Thijmen